


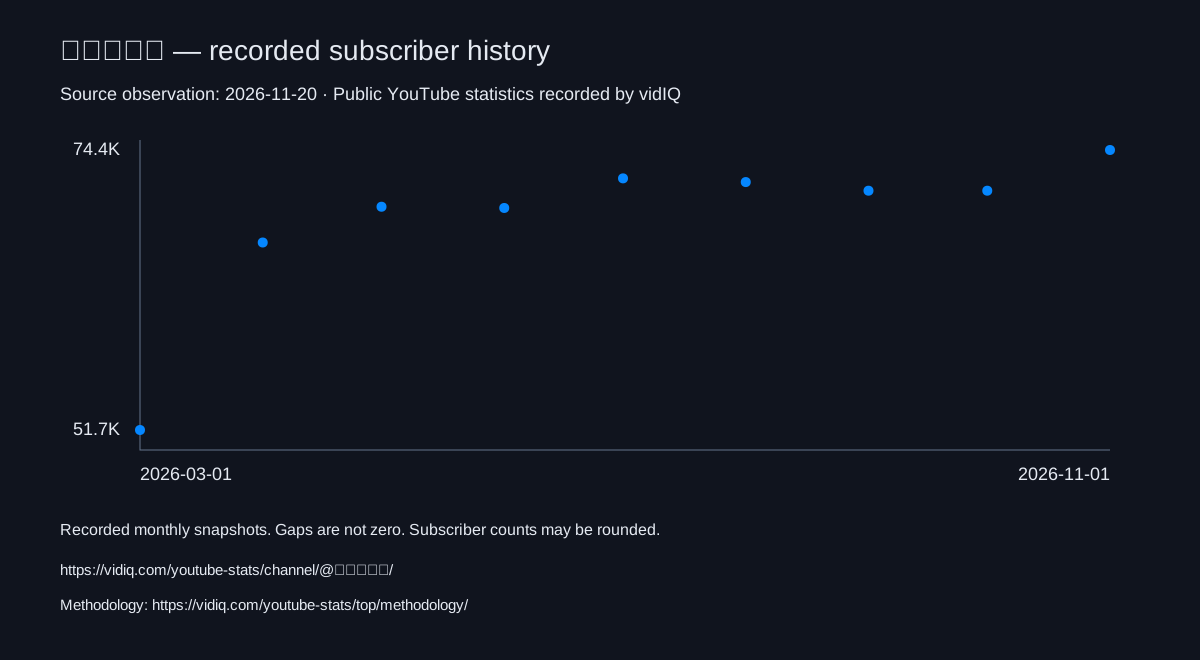
As of 2026-11-20, 経済の地図 has 75,200 subscribers, 3,223,286 total views, and 72 videos. Over the last 7 days, it gained 100 subscribers. Over the last 28 days, it gained 2,000 subscribers, averaged 59,265 views per day, and published 28 videos.
Channel Description
「経済の地図」へようこそ! 難しくて複雑な経済を、図解を使ってどこよりも分かりやすく解説します。 経済の仕組みをマスターして, 世の中の流れを読み解きましょう!
Counts reflect public YouTube data and may be rounded. Earnings are modelled ad revenue estimates, not reported creator income; sponsorships, memberships and merchandise are excluded.
The exact earnings measurement window is unavailable.
Data sources and methodologyCite these statistics
vidIQ. As of 2026-11-20, 経済の地図 has 75,200 subscribers, 3,223,286 total views, and 72 videos. It ranks #881,013 by subscribers among channels tracked by vidIQ. Source: public YouTube statistics recorded by vidIQ. https://vidiq.com/youtube-stats/channel/@経済の地図/ Methodology: https://vidiq.com/youtube-stats/top/methodology/
YouTube sourceShareable history chartResearch and media guide
See stats like these on every channelSee stats like these on every channel you visit
Subscribers, views, earnings, and rankingsSubscribers, views, earnings, rankings, and more. Right inside YouTube, free forever.