


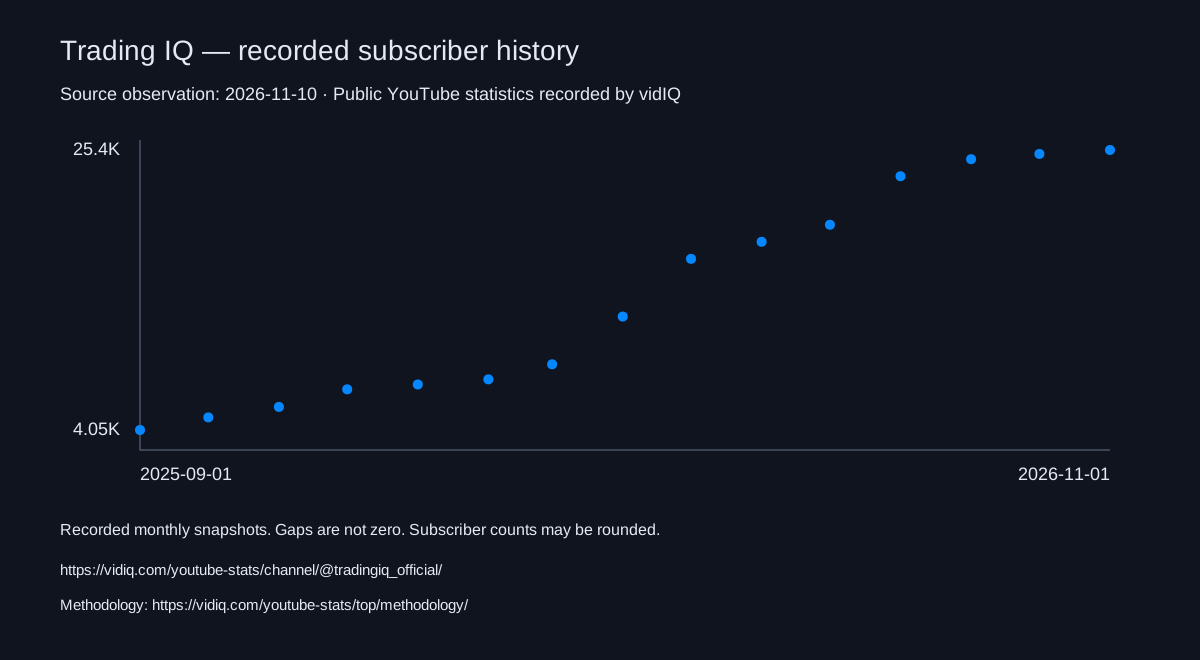
As of 2026-11-10, Trading IQ has 25,400 subscribers, 1,582,018 total views, and 318 videos. Ranked #1,997,655 worldwide, #26 in Liechtenstein and #104,772 in Education by subscribers.
Trading IQ ’s most recent 48 uploads
- The latest upload vidIQ has for Trading IQ is “Footprint Chart Mastery for Volume”, a Short published Aug 25, 2026.
- These are Trading IQ ’s 48 most recent public uploads vidIQ has data for, published between Jun 25, 2026 and Aug 25, 2026 (11 long-form videos and 37 Shorts).
- Median views across these 48 uploads: 1,072. 24 videos are above that median and 24 below.
- Most viewed in the sample: “I Built a Support & Resistance Indicator on Steroids (It's FREE)” (68,497 views, Jul 1, 2026). Least viewed: “Unlock Trading Insights Better Delta Profiles Explained” (292 views, Jun 29, 2026).
- Median length: 9:48 for 11 long-form videos; 0:52 for 37 Shorts.
- In this sample, Trading IQ ’s consecutive uploads were a median of 1 day apart (shortest gap 1 day, longest 5 days).
- Views are lifetime totals as of Nov 10, 2026, so newer uploads have had less time to collect them. These figures describe only the videos listed here, not the whole channel, and do not show why any video performed as it did. Dates are UTC.
vidIQ MCP
Audit Trading IQ in ChatGPT or Claude
Add vidIQ to your AI assistant and ask “Audit Trading IQ ’s last 48 videos and tell me which ones got more views than the median of those videos.” It answers with live vidIQ data. Included in every plan, even Free.
This page covers public data only. A channel owner can connect their own YouTube channel to vidIQ to add private analytics, such as retention and traffic sources, to the audit.
 Add to ChatGPT
 Add to Claude
Counts reflect public YouTube data and may be rounded. Earnings are modelled ad revenue estimates, not reported creator income; sponsorships, memberships and merchandise are excluded.
The exact earnings measurement window is unavailable.
Data sources and methodologyCite these statistics
vidIQ. As of 2026-11-10, Trading IQ has 25,400 subscribers, 1,582,018 total views, and 318 videos. It ranks #1,997,655 by subscribers among channels tracked by vidIQ. Source: public YouTube statistics recorded by vidIQ. https://vidiq.com/youtube-stats/channel/@tradingiq_official/ Methodology: https://vidiq.com/youtube-stats/top/methodology/
YouTube sourceShareable history chartResearch and media guide
See stats like these on every channelSee stats like these on every channel you visit
Subscribers, views, earnings, and rankingsSubscribers, views, earnings, rankings, and more. Right inside YouTube, free forever.