


As of 2026-11-10, Chemometrics & Machine Learning in Copenhagen has 7,310 subscribers, 1,223,746 total views, and 134 videos. Ranked #4,639,255 worldwide, #5 in Dominica and #244,873 in Education by subscribers.
Long-form and Shorts views include estimates from monthly format proportions. These estimates are not observed daily counts.
Chemometrics & Machine Learning in Copenhagen’s latest YouTube video
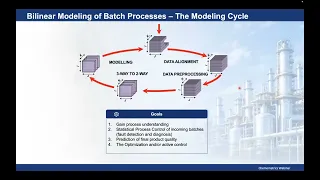
A Walk Through the Bilinear Modeling Cycle for Batch Processes
Oct 28, 2026
First 12 days and 14 hours
vidIQ MCP
Ask ChatGPT or Claude about Chemometrics & Machine Learning in Copenhagen
Add vidIQ to your AI assistant and ask “How fast is Chemometrics & Machine Learning in Copenhagen growing this month?” It answers with live vidIQ data. Included in every plan, even Free.
 Add to ChatGPT
 Add to Claude
| Videos | Total views | VPH | Outlier score | |
|---|---|---|---|---|
| 3.94K | 0.1 | 5.44x | ||
| 2.86K | - | - | ||
| 2.85K | 0.1 | 2.24x | ||
| 2.8K | 0.1 | 3.85x | ||
| 1.78K | - | - |


Chemometrics & Machine Learning in Copenhagen’s long-form vs Shorts performance
Daily subscribers & views for Chemometrics & Machine Learning in Copenhagen
All 30 recorded daily snapshots available for this channel. Dates are UTC. Missing days are not filled in. Negative changes can reflect corrections to public counts; earnings are estimates.
View 16 more days
Monthly history for Chemometrics & Machine Learning in Copenhagen
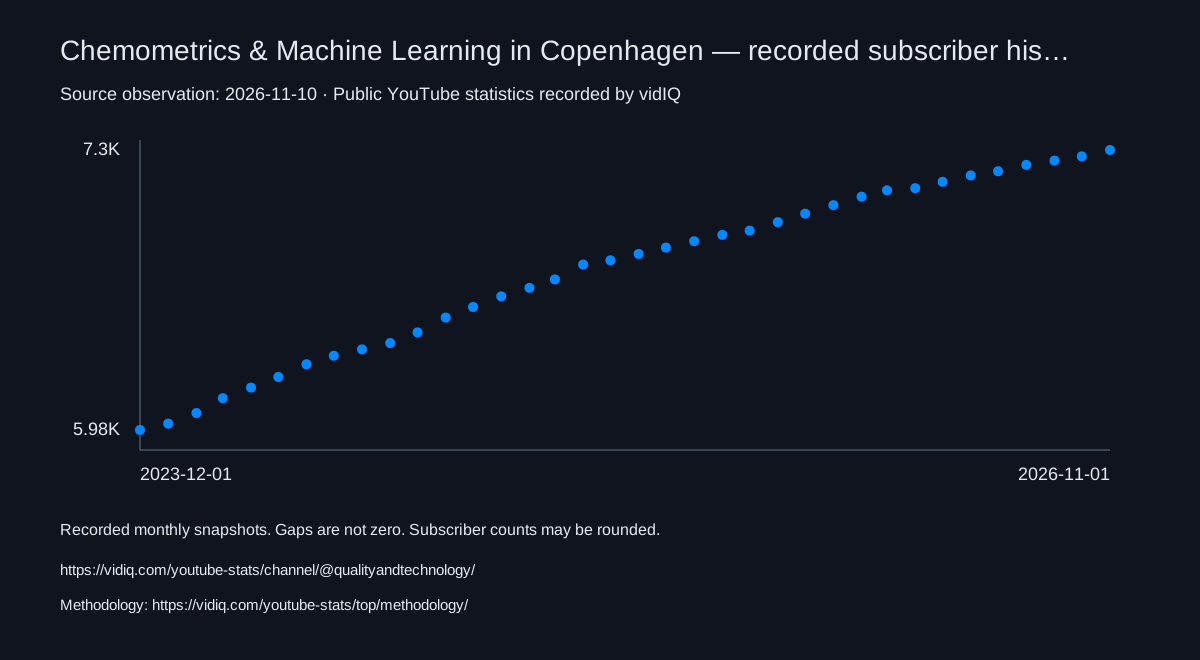
In October 2026, Chemometrics & Machine Learning in Copenhagen gained 30 subscribers and got 4,011 views. Each month shows its net change and the totals at its end.
| Month | Subscribers | Subscribers gained | Views | Views gained |
|---|---|---|---|---|
| October 2026 | 7.3K | +30 | 1.22M | +4.01K |
| September 2026 | 7.27K | +20 | 1.22M | +3.52K |
| August 2026 | 7.25K | +20 | 1.22M | +2.27K |
| July 2026 | 7.23K | +30 | 1.21M | +2.04K |
| June 2026 | 7.2K | +20 | 1.21M | +2.27K |
| May 2026 | 7.18K | +30 | 1.21M | +2.68K |
| April 2026 | 7.15K | +30 | 1.21M | +2.81K |
| March 2026 | 7.12K | +10 | 1.2M | +2.81K |
| February 2026 | 7.11K | +30 | 1.2M | +2.84K |
| January 2026 | 7.08K | +40 | 1.2M | +3.01K |
| December 2025 | 7.04K | +40 | 1.19M | +2.38K |
| November 2025 | 7K | +40 | 1.19M | +3.06K |
View more 24 months
Chemometrics & Machine Learning in Copenhagen Frequently Asked Questions
How many subscribers does Chemometrics & Machine Learning in Copenhagen have?
Chemometrics & Machine Learning in Copenhagen has 7,310 subscribers as of 2026-11-10.
How many views does Chemometrics & Machine Learning in Copenhagen have?
Chemometrics & Machine Learning in Copenhagen has 1,223,746 total video views as of 2026-11-10.
How many videos has Chemometrics & Machine Learning in Copenhagen uploaded?
Chemometrics & Machine Learning in Copenhagen has uploaded 134 videos as of 2026-11-10.
What is Chemometrics & Machine Learning in Copenhagen's estimated YouTube ad revenue?
vidIQ models about $8 USD in YouTube ad revenue for Chemometrics & Machine Learning in Copenhagen as of 2026-11-10. This is a modelled estimate, not income reported by the creator or YouTube. The exact earnings measurement window is unavailable.
What is Chemometrics & Machine Learning in Copenhagen's subscriber rank?
Chemometrics & Machine Learning in Copenhagen is ranked #4,639,255 by subscribers among channels tracked by vidIQ as of 2026-11-10.
How many subscribers did Chemometrics & Machine Learning in Copenhagen gain in the last 28 days?
Chemometrics & Machine Learning in Copenhagen gained 30 subscribers between 2026-10-14 and 2026-11-10.
How many views did Chemometrics & Machine Learning in Copenhagen get in the last 28 days?
Chemometrics & Machine Learning in Copenhagen got 3,821 views between 2026-10-14 and 2026-11-10.
How much did Chemometrics & Machine Learning in Copenhagen grow in October 2026?
In October 2026, Chemometrics & Machine Learning in Copenhagen gained 30 subscribers and got 4,011 views.
When did Chemometrics & Machine Learning in Copenhagen start their channel on YouTube?
Chemometrics & Machine Learning in Copenhagen started their YouTube channel on September 6, 2010.
What country is Chemometrics & Machine Learning in Copenhagen YouTube channel from?
Chemometrics & Machine Learning in Copenhagen has its channel country set to Dominica on YouTube.
Ready for YouTube growth?
Take your views to the next level with keyword insights, video ideas, and even more growth tools from vidIQ.
Counts reflect public YouTube data and may be rounded. Earnings are modelled ad revenue estimates, not reported creator income; sponsorships, memberships and merchandise are excluded.
The exact earnings measurement window is unavailable.
Data sources and methodologyCite these statistics
vidIQ. As of 2026-11-10, Chemometrics & Machine Learning in Copenhagen has 7,310 subscribers, 1,223,746 total views, and 134 videos. It ranks #4,639,255 by subscribers among channels tracked by vidIQ. Source: public YouTube statistics recorded by vidIQ. https://vidiq.com/youtube-stats/channel/@qualityandtechnology/ Methodology: https://vidiq.com/youtube-stats/top/methodology/
YouTube sourceShareable history chartResearch and media guide
See stats like these on every channelSee stats like these on every channel you visit
Subscribers, views, earnings, and rankingsSubscribers, views, earnings, rankings, and more. Right inside YouTube, free forever.