All videos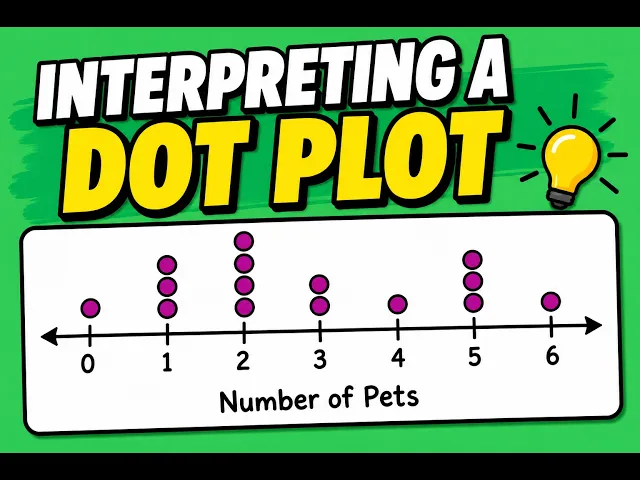 2:24Watch on YouTube
2:24Frequency Table from a Dot Plot Graph
Total views993
VPH—
Likes3
Comments1
Engagement Rate0.4%
Since published
993
vidIQ MCP
Ask ChatGPT or Claude about this video
Add vidIQ to your AI assistant and ask “How does this video compare to MooMooMath and Science's other uploads?” It answers with live vidIQ data. Included in every plan, even Free.
 Add to ChatGPT
 Add to Claude
No video changes
No title or thumbnail changes have been recorded for this video.
See stats like these on every channelSee stats like these on every channel you visit
Subscribers, views, earnings, and rankingsSubscribers, views, earnings, rankings, and more. Right inside YouTube, free forever.