Summary: Video creators have access to A TON of analytics, but which ones should you prioritize to get more views and subscribers? Dive into the top 5 vidIQ-approved analytics and grow your YouTube channel fast.
Curious which analytics you should be focusing on in the coming months to help grow your channel? Look no further — here are the top 5 analytics to get you more views and subscribers on YouTube in 2019.
Note: In order to follow along you’ll need to access the new YouTube Studio beta. If you’re still on Creator Studio Classic, you'll see a big blue “YOUTUBE STUDIO BETA” link in the top-left-hand corner. Click there and you'll instantly see a radically different analytics page.
1. Click-through rate
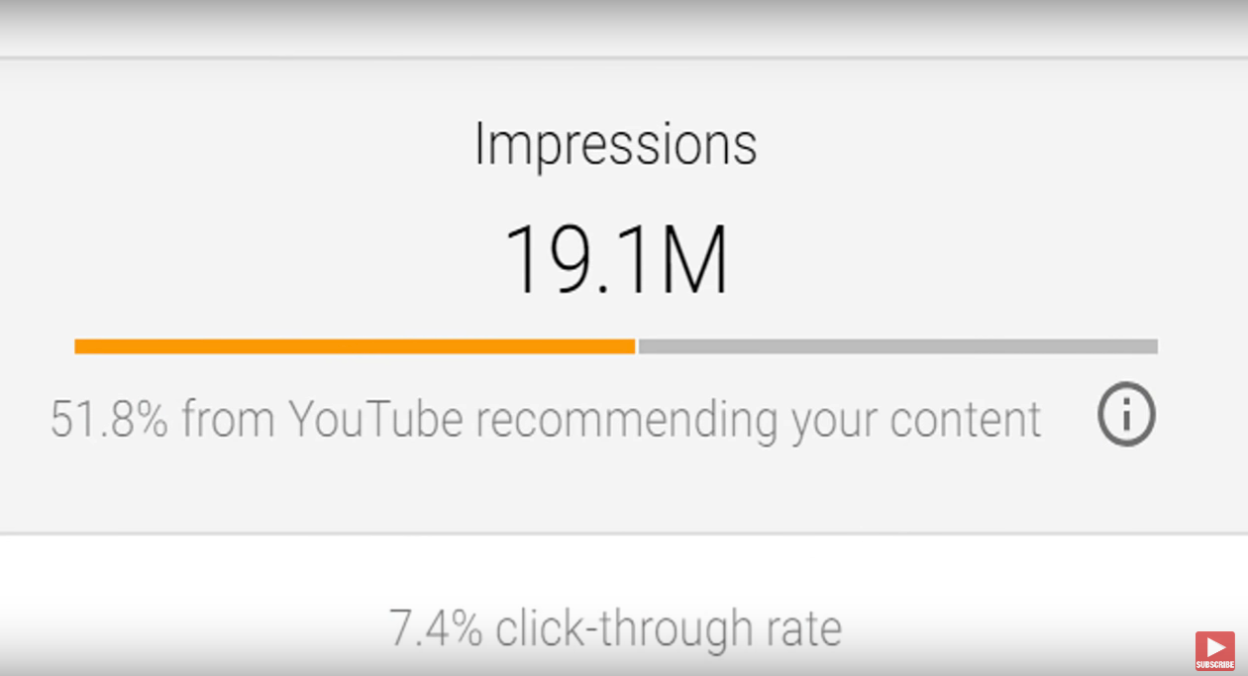
The first analytic we want to look at is click-through rate. Put simply, your click-through rate is the number of times somebody clicks on one of your thumbnails or titles from the total number of times it's been seen.
So if three people see your video and one of them chooses to watch it, that’s a click-through rate essentially of 33.3%.
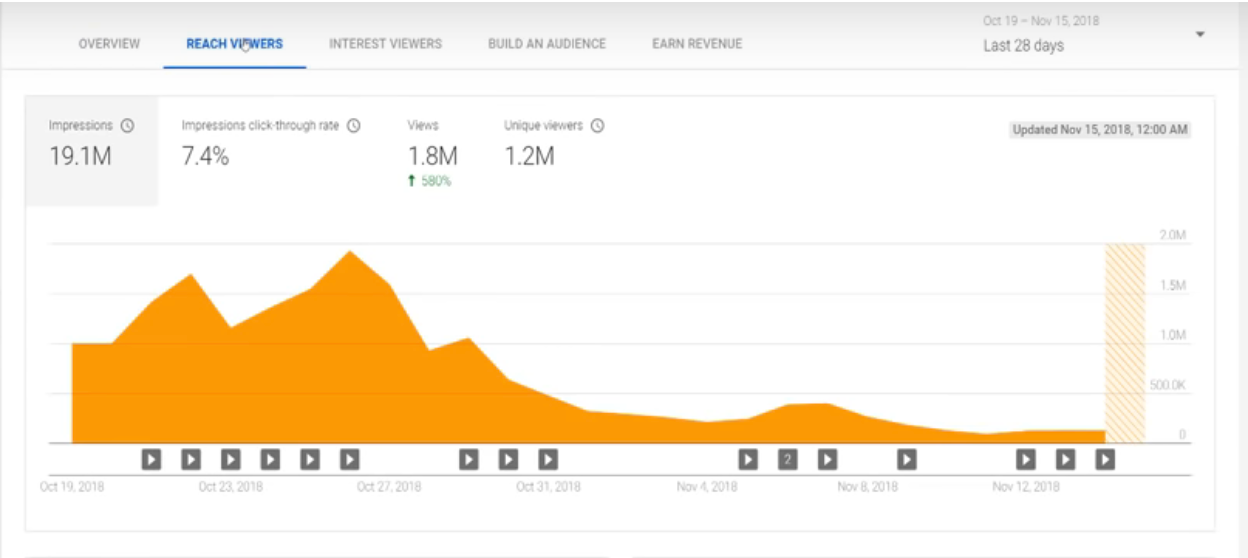
In the YouTube Studio beta, you can see the impressions and click-through rates for the past 28 days by simply navigating to “Analytics” from the dashboard and then clicking on “Reviewers.”
You can also go to different cards in the YouTube analytics and look at a breakdown of click-through rates. So if I click on Top Videos, for example, it will list the click-through rate for individual videos as well.
Now if you’re wondering why you should care about your click-through rate, here are three key reasons:
Every single analytic from your YouTube channel trickles down from click-through rate. People have to actually click on your thumbnail to watch your content before you can gain traction with other analytics such as watchtime, subscribers, comments, and all the rest of that good stuff.
Viewers judge videos by their thumbnails just as readers judge books by their covers, so it's really important to have a good first impression. Your click-through rate represents intrigue — of topic, thumbnail or title. For example, recently we covered the subscriber rate of PewDiePie vs. T-Series. Because it was a very intriguing topic at the time, and we used very targeted keywords and colorful thumbnails, our click-through rate for that particular topic went through the roof.
An important to remember about click-through rate is it’s not an exact science. I often hear people say between 2% and 10% is a “good” click-through rate, but I think it’s better to focus simply on improving your click-through rate.
Click-through rates vary from video topic to video topic, and it's heavily influenced by where you are simply in the order of suggested videos and search pages. If you're at the top of a search page, you can have a terrible thumbnail but a high click-through rate simply because of the prime real estate.
Don't get too caught up comparing your click-through rate versus somebody else's. Look at your click-through rate, and aim to improve it one or two percentage points over 2019 — that will bring in a significant number of views.
2. Audience retention
Channel analytics can give you some insight into average view duration, but a more accurate approach is look at audience retention on individual videos.
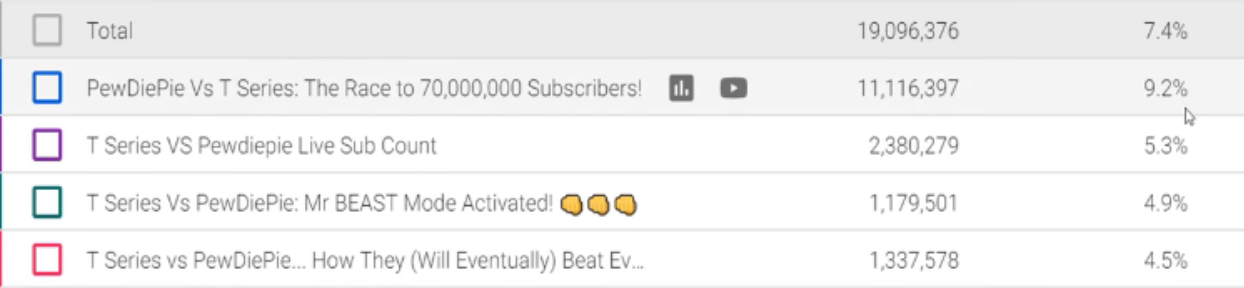
To do this, click “Videos” along the left-hand nav. Click on the video that you want to investigate and you’ll see audience retention.
Mouse over the graph and you'll see the audience retention at a specific point in the video, or click on a point and then press play. Doing so will allow you to see the audience retention alongside the video in real-time, giving you clues to investigate drops and spikes in retention.
And if you’re thinking that watchtime is the ultimate analytic king on YouTube and not audience retention, consider that YouTube tends to favor content with more than 50% audience retention. So whether your videos are two minutes long, four minutes long or six minutes long, aim first to make your content better to improve audience retention, and then start to think about making longer videos if that's what you want to do with your content to get more watchtime.
3. Recommended Content
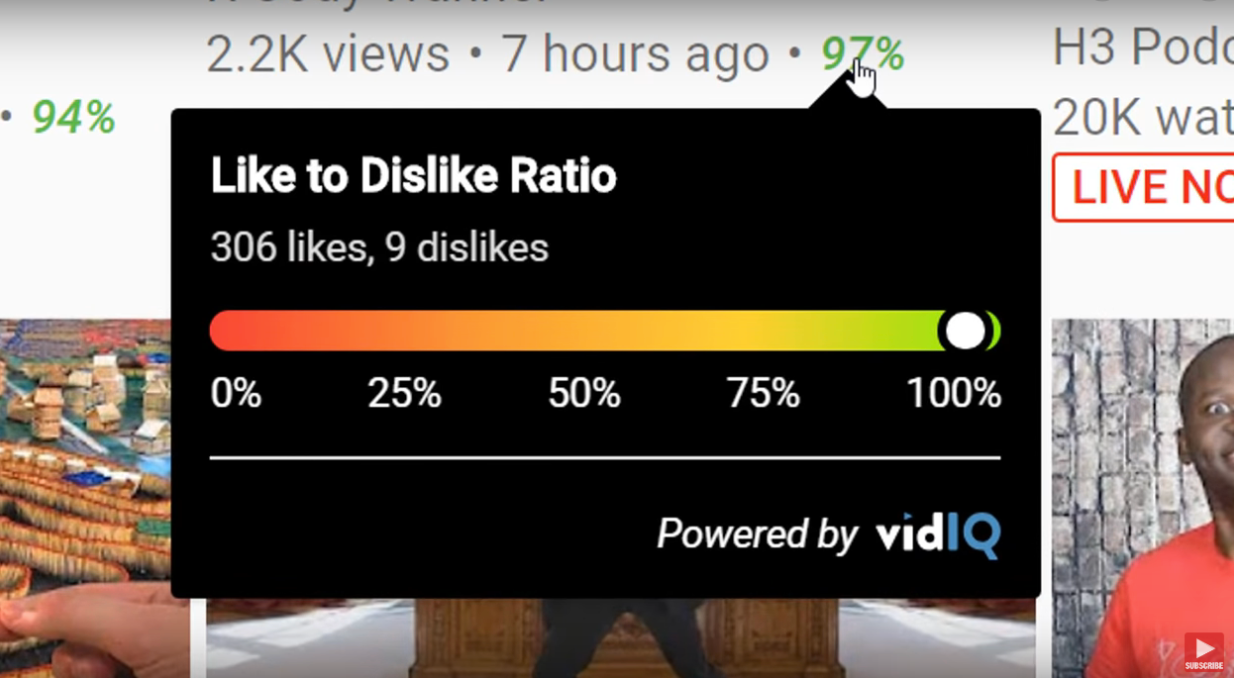
Each individual video has likes and dislikes, and vidIQ has a funky little tool that turns these metrics into a Likes to Dislikes Ratio.
But what if you want this for your entire channel?
Well they do in the form of YouTube recommended content. When viewers watch your content and enjoy it, they generally watch for longer, and YouTube loves this.
When YouTube loves your content, they want to share it with more people. That means putting it on the homepage, Browse Features and the suggested videos on watch pages — and the more you can push this line into the orange, the more YouTube is doing all the hard work for you.
Rather than people having to search to find your content or find it through the subscription feeds, they're finding it in random places because YouTube wants to share your content with a wider audience.
So how do you manipulate this magic formula to get it to work for you? Engaging thumbnails, intriguing titles — which are then clicked onto — increased watchtime on your content and, as we mentioned, getting above 50% with your audience retention.
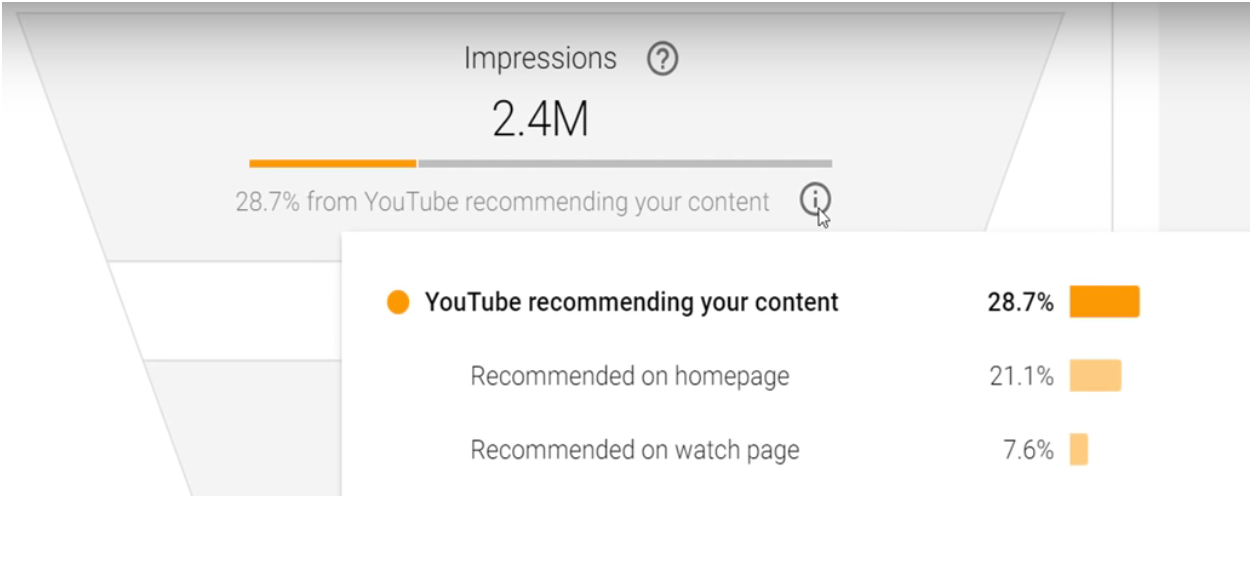
For example, take a look at vidIQ’s September analytics below. Notice the 2.5 million impressions, 27.8% of which came from YouTube recommending our content.
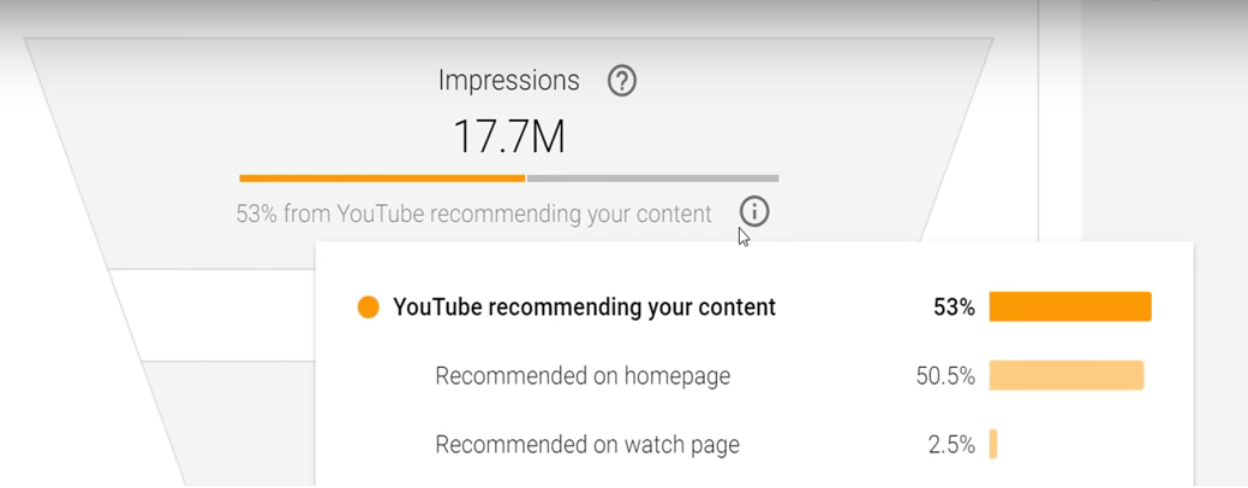
Now take a look at vidIQ’s analytics for October when the T-Series vs. PewDiePie subscriber rates was in full flow.
Look at the radical change here: 17 million impressions, and YouTube was recommending our content way more, especially on homepages.
We were feeding YouTube exactly what they wanted and so they responded by sharing it with a much wider audience.
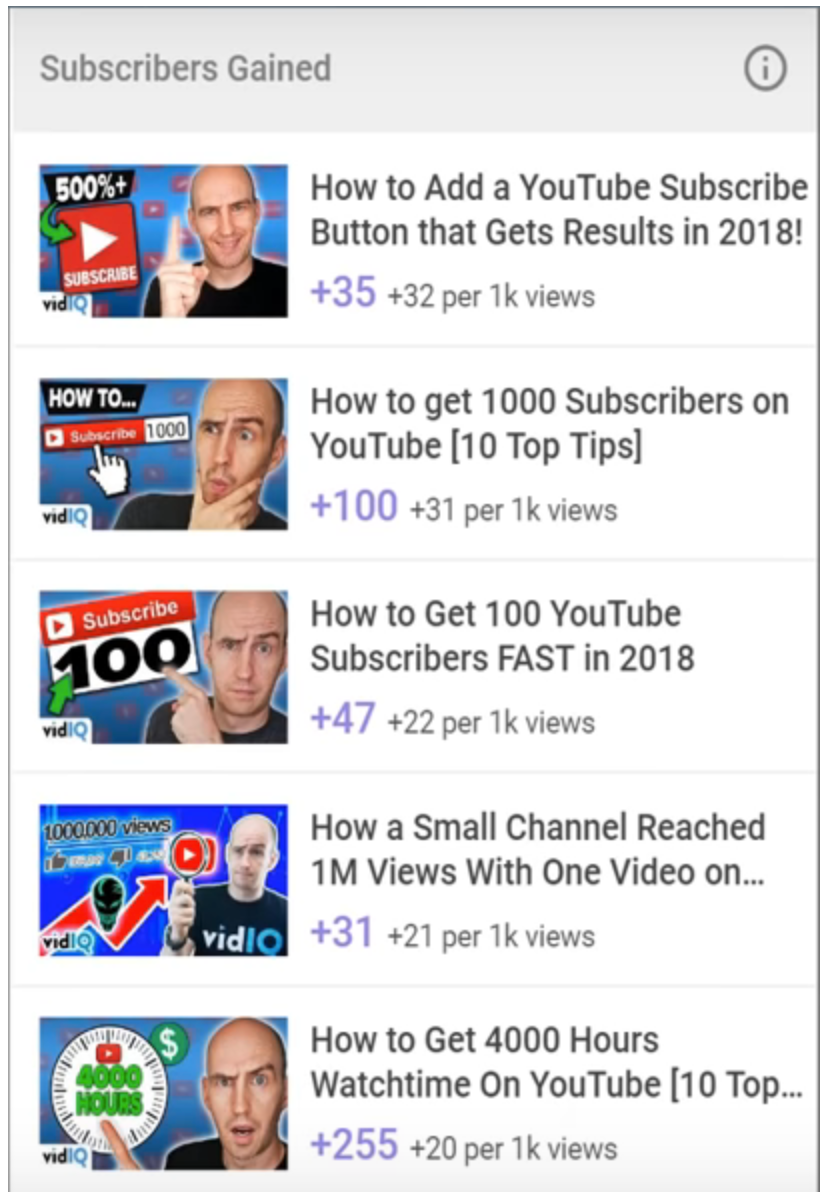
4. Subscribers gained
I may be missing something here in the new analytics dashboard, but I can't find a good way to show subscribers gained from videos, so we're going old school here.
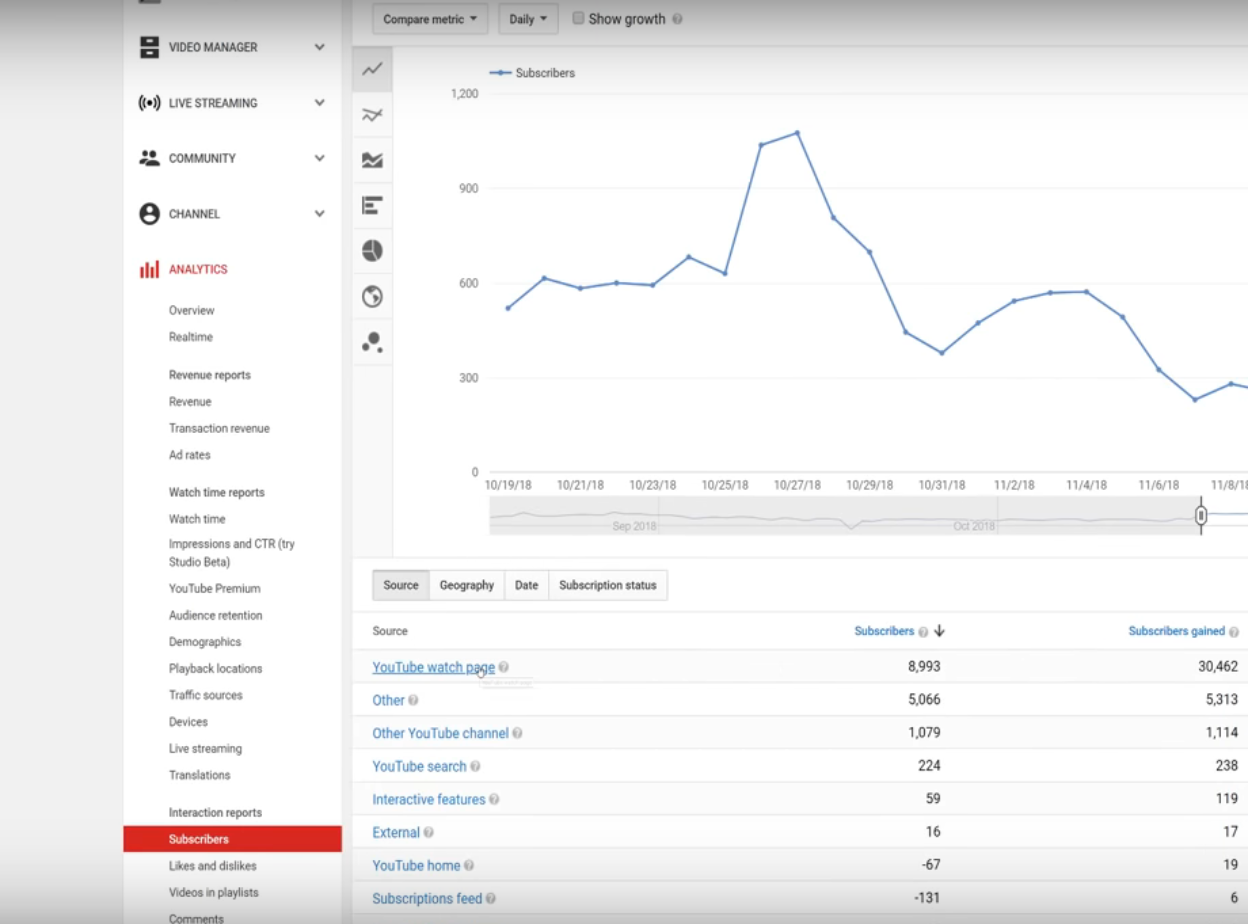
Navigate to Creator Studio Classic, click on “Subscribers” and then “YouTube watch page”. This will show you all the videos that are converting viewers into subscribers.
Since there is no analytic that tracks trust, tracking subscribers gained is the next best thing. Think about it, why else would someone subscribe to your channel unless they trust you — trust you to entertain, educate or emotionally impact you.
People who subscribe to your channel from a video watch page usually do it because they’ve experienced a light bulb moment — something that instinctively and instantly drives them to click that button.
In vidIQ you can look at subs gained a lot quicker than through YouTube analytics through the subs gained column on our channel audit.
If you click on “View More”, you can see all of the videos that are driving viewers to turn into subscribers. It's almost like your trust column.
We also have click-through rate, audience retention, YouTube recommended content, and subscribers gained.
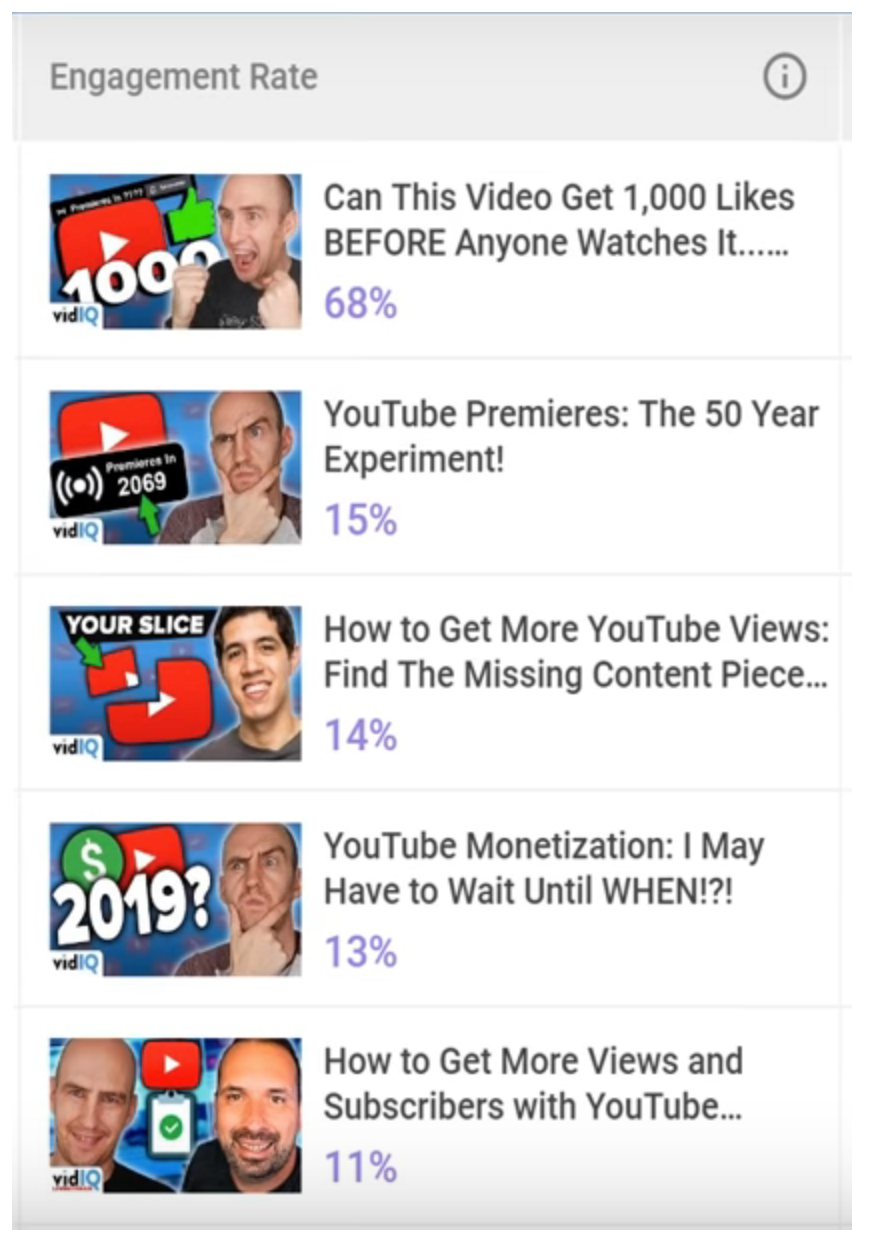
5. Audience engagement
We said earlier that gaining subscribers through your videos is like building trust with your audience. Gaining comments, likes and dislikes through your videos is building engagement — another really important facet of YouTube.
Strictly speaking, YouTube doesn't track engagement rate, but the vidIQ channel audit tool does. Use it to see which videos are generating conversation or whether they're polarizing in terms of how many people react to it with likes versus dislikes.
Astonishingly here, we have one video with 68% engagement rate, but that's because we were having a little bit of fun with YouTube premieres.
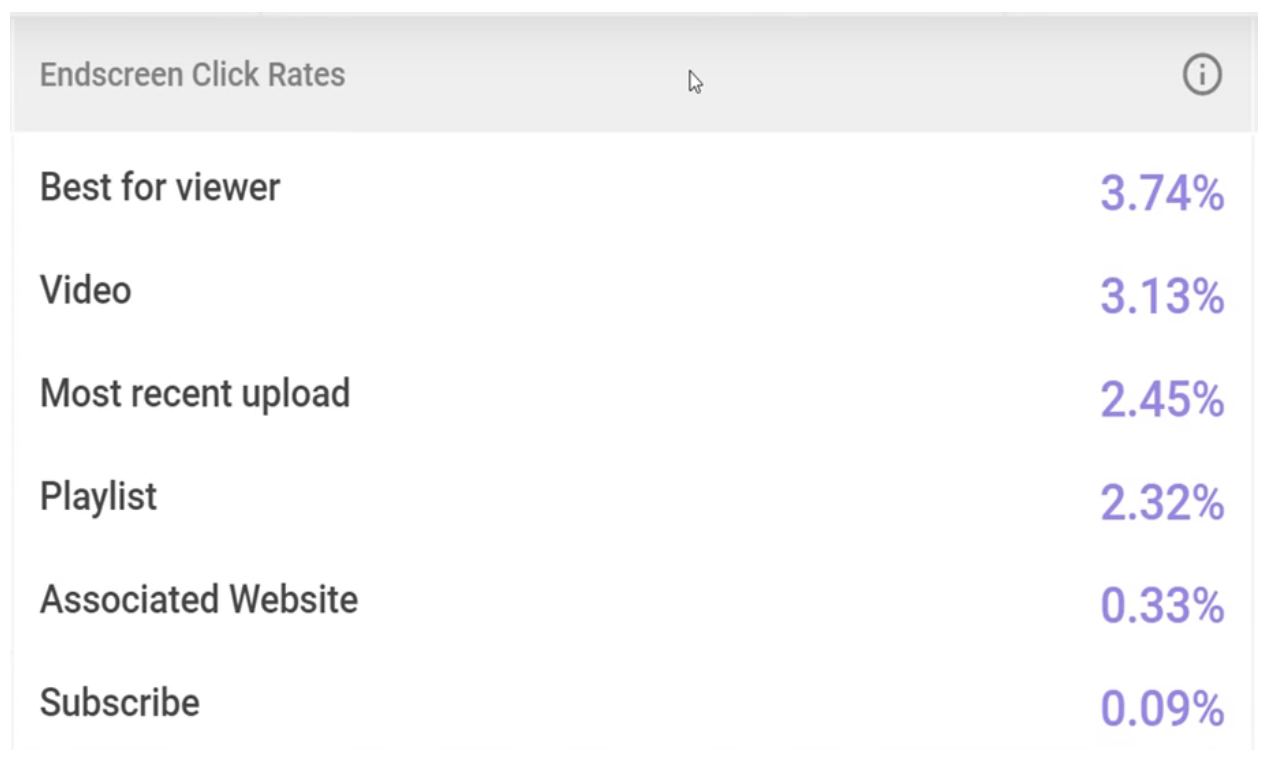
In terms of engagement rates, we also want to look at the finer points as well. If we scroll down the channel audit page, we can look at how often the end screens are clicked on — you know, those boxes right at the end of videos.
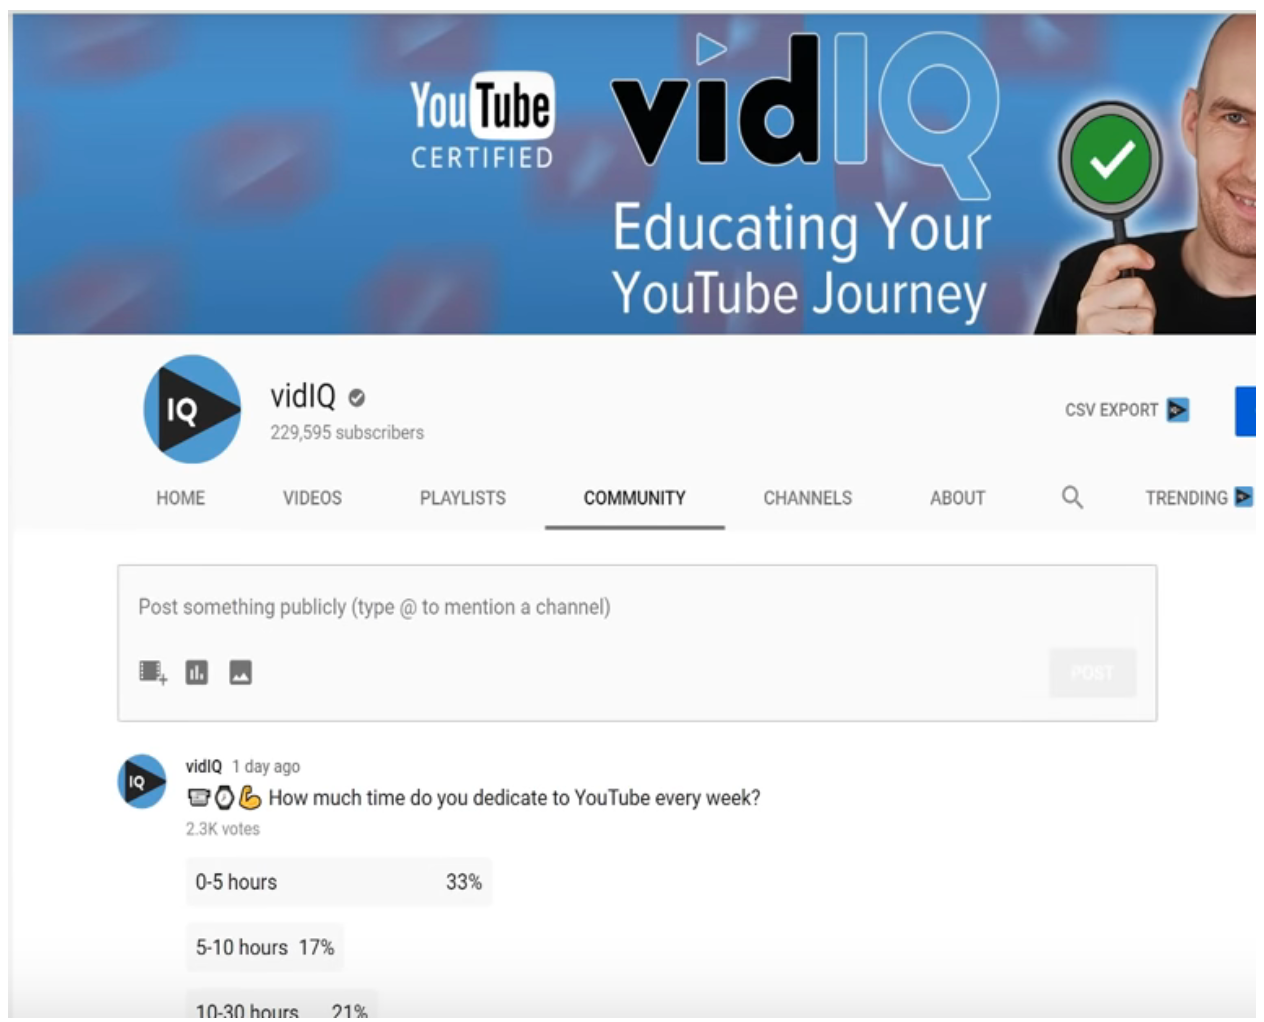
As a final thought on engagement, don’t forget the Community tab if you have access to it.
Use it to ask your audience what video you should make next, collect general feedback or start a conversation. You might be surprised by the response. In fact, we’ve found that some of our posts are getting more feedback from the videos themselves.
Our call to action
All of these analytics are super important, but if you don’t actually do something with them then you’re missing the point. Remember: Doing the same thing over and expecting different results is a sign of insanity.
Our challenge to you is simple: Act on the data you’re getting from YouTube and vidIQ, share your experiments with us on Twitter and good luck in growing your channel in 2019!
Want To Get More YouTube Views?
If you want to take your YouTube channel to the next level then make sure to download vidIQ. It will help you research YouTube, analyze videos, audit your own channel, and take actionable steps click here to install now!
Carla Marshall is the Head of Content Marketing at vidIQ. She has 10+ years of experience in video marketing, social media management, content marketing, DRM, and SEO. She was previously Editor in Chief at ReelSEO.com, and as a journalist and video marketer, she's covered news stories, creator journeys, and digital-first publishing initiatives across all the major online video platforms. She is YouTube Certified and a judge for the Shorty Awards, as well as the UK, US, Canadian, Global, and EU Search Awards.