vidIQ Research, September 2026
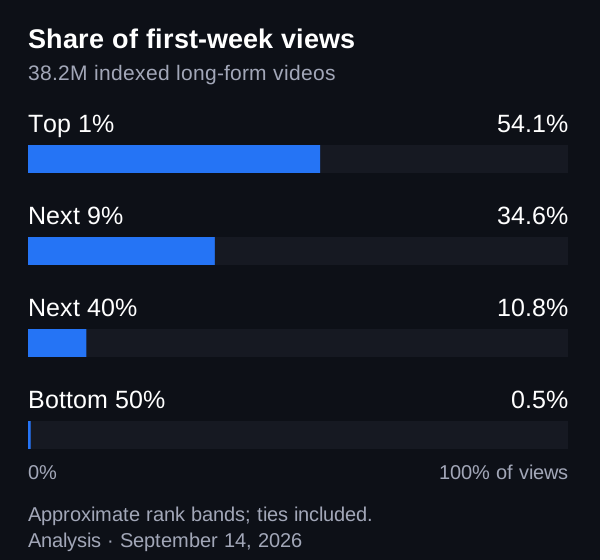
Top 1% of Videos Earned 54% of First-Week Views
Our analysis of 38.2 million indexed long-form videos published from August 15 through September 5, 2026 shows how concentrated views are in the first week.
vidIQ Research/Updated September 16, 2026
Study parameters
38,229,639
Long-form videos analyzed
7 days
View measurement window
Aug 15 to Sep 5
2026 publication window
The finding
A small share of uploads accounted for most first-week views
The top approximate 1% earned 54.1% of this cohort’s first-week views. The next approximate 9% earned 34.6%, the next approximate 40% earned 10.8%, and the bottom approximate half earned 0.5%. Together, these videos accumulated 261,962,388,719 first-week views. For publishers, the takeaway is simple: a small share of uploads drove most of the views we measured.
The typical video got 234 views in its first week
In this cohort, 37.7% of videos had fewer than 100 first-week views, 70.1% had fewer than 1,000, and 8.5% had at least 10,000. These thresholds describe individual videos, not channels.
| Approximate percentile in this cohort | First-week views |
|---|---|
| 50th (median) | 234 |
| 90th | 8,154 |
| 99th | 109,778 |
| 99.9th | 663,099 |
What this does not prove
- These results describe eligible tracked and indexed videos with available day-seven data, not every upload on YouTube or a representative census.
- The analysis does not classify faceless, generic, or AI-produced videos and supports no claims about their performance.
- There is no restriction by geography, language, or channel size, and results are not adjusted for channel size.
- This observational distribution does not establish algorithmic causes, prove a publishing prescription, or predict any individual video’s outcome.
- Shorts are excluded by long-form classification. Livestreams were not separately filtered out.
Methodology
- In this September 14, 2026 analysis, first-week views are measured for eligible indexed long-form videos.
- Primary publication interval: 2026-08-15 (inclusive) to 2026-09-06 (exclusive), calculated as 30 days and 8 days before 2026-09-14.
- Eligibility: indexed videos matched to a long-form source, with an available observed day-seven view measurement and metadata updated on or after 2026-08-15. Shorts are excluded by long-form classification; no separate livestream exclusion was applied.
- Deduplication: retain the maximum available day-seven view measurement per video. The resulting primary cohort contains 38,229,639 videos and 261,962,388,719 first-week views. This metric is views at seven days, not current or lifetime views.
- Bands use approximate percentile thresholds with ties: top 1% is at or above p99; next 9% is at or above p90 and below p99; next 40% is at or above p50 and below p90; bottom 50% is below p50. These are not exact ranked headcount buckets. Approximate thresholds are p50: 234, p90: 8,154, p99: 109,778, and p99.9: 663,099 first-week views.
- View shares divide each band’s first-week views by total cohort first-week views. The rounded reported shares, 54.1%, 34.6%, 10.8%, and 0.5%, sum to 100%. Video threshold rates are 37.7% with fewer than 100 views, 70.1% with fewer than 1,000, and 8.5% with at least 10,000.
- An older 31 to 60-day publication window shows a top approximate 1% view share of 54.5%, a bottom-half share of 0.48%, and a cohort median of 170 first-week views. The older-window comparison is limited to these summary measures.